
Hi! This is the explanation of what devices we have at the Junction. The protocols and message formats and how to use the devices.
At the Junction we provide you the Industrial RFID reader manufactured by Imping. We use Stora Enso Track and Trace backend to report the readings to our cloud and allow you to subscribe for the events over MQTT.
The MQTT broker is hosted at the mqtt.intelligentpackaging.online. See the mqtt folder for an example React application that listens necessary topics.
The MQTT accepts connections over TCP on the standard MQTT port
1883or over WebSocket over port9001.
To start test application execute:
npm start
The industrial readers are usually used to track the item over place and time. It has up to four antennas and each of them can report to a one single location.
In our Junction case we defined four test locations:
- Junction.2017.1
- Junction.2017.2
- Junction.2017.3
- Junction.2017.4
Every time UHF tag is changing the location, the MQTT message is broadcasted under the following topics:
location/:locationId/tagEntered- fires every time tag has entered the location with:locationId;location/:locationId/tagLeft- fires every time tag has left the location with:locationId
Payload of the message is only tag ID (aka EPC code) - a unique tag identifier written by the manufacturer - a HEX number with 12 bytes (96 bits).
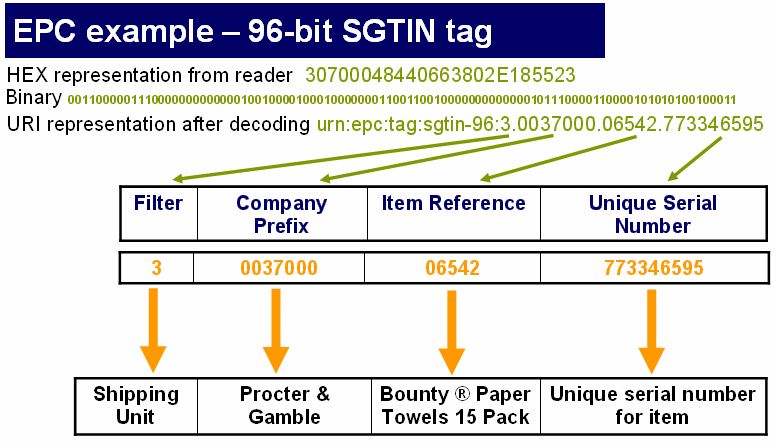
Don't worry, you don't need to know what are the parts of the EPC, just know - they are unique and can act as identifiers.
For instance in our case if you subscribe for the topic location/Junction.2017.3/tagLeft you will receive EPC code of the tag each time it is appears there.
The reader you will get at Junction is configured so each antenna reports to each location according to antenna number.
Also you can use standard MQTT wildcard + or # to compose flexible subscriptions. More info on wildcards
Install mqtt package
npm install mqtt
Create client
import mqtt from 'mqtt';

// notice, this example is running over web sockets
let client  = mqtt.connect({
    host: 'mqtt.intelligentpackaging.online',
    port: 9001
});
Subscribe for interested topics when client is connected
client.on('connect', () => {
    client.subscribe('location/+/tagEntered');
    client.subscribe('location/+/tagLeft');
})
Receive message and do stuff
client.on('message', (topic, message) => {
    // NOTE! message comes as an array of bytes.
    console.log(topic, message.toString());

    // do stuff here...
});Probably you all know what are NFC tags. Near-field communication tags. They can be encoded by several fields and then, when scanned by phone, start an application, open URL, show contact details, etc.
In junction we have pre-encoded NFC tags, every time any of them is scanned by mobile phone, the MQTT event is fired.
The topic to listen to is
nfc/scan- fires every time NFC tag is scanned.
Note, you will probably see the message after scanning: The tag is not found on your phone screen - don't worry, the logic here is the proxy, after scanning, emits the message and also redirects user to the predefined web-site.
In our case we don't have predefined web site for Junction hacks. Ask me if you want to redirect tags to certain URL.
The payload of the MQTT event is the tag EPC code.
Together with connected boxes Stora Enso provides air quality sensors to monitor air in the warehouse. The sensors can report the following values:
- Temperature
- Relative air humidity
- Level of CO2
- Luminosity
- Movement detected
VOC(not available at the sensors we can provide at the moment)
The sensors are fully autonomous and always report to the cloud, no need to connect them to power source or to the network.
Sensors are always online and are using LoRa network to broadcast measured values.
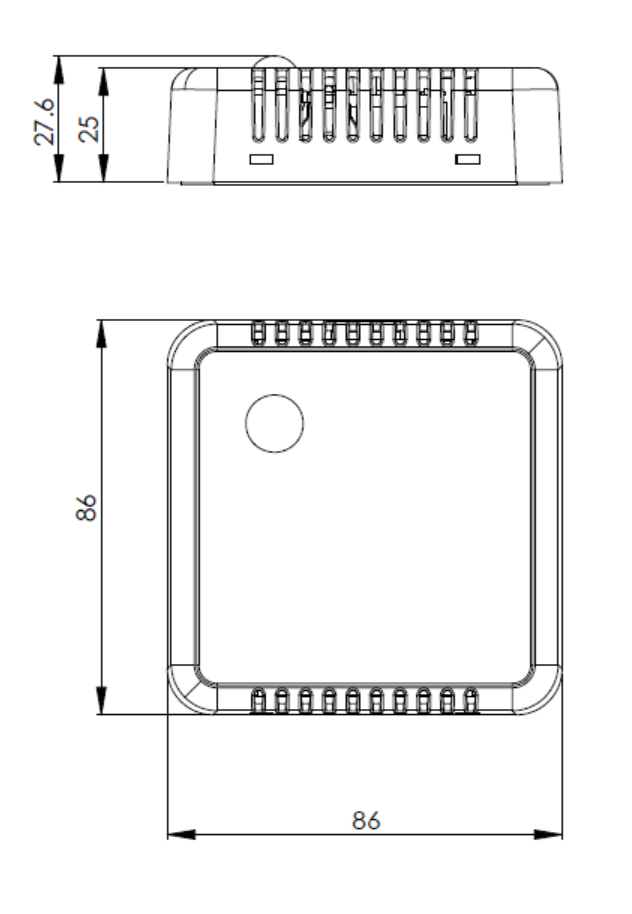
The sensors report every 15 minutes. Stora Enso provides GraphQL API to fetch the data.
We provide you a sendbox where you can compose and test API queries
https://woodcityapiqa.azurewebsites.net/graphiql/index.html
Navigate there, build up query, test result data and use it in your application and API.
With the API you can query all or any of the above air wuality metrics:
- Per country (
"FIN"); - Per building (
"Junction2017"); - Per building floor - assuming we have one floor only, but we can change it if we appear to have multiple floors (
1); - Per room on the floor (
"<room name>"TBD); - Per each sensor (
"<serial number>").
Also for building you can query sensors, floors and rooms.
Use
Ctrl+Spacein the sandbox to get available composition values andPlaybutton to test the query.
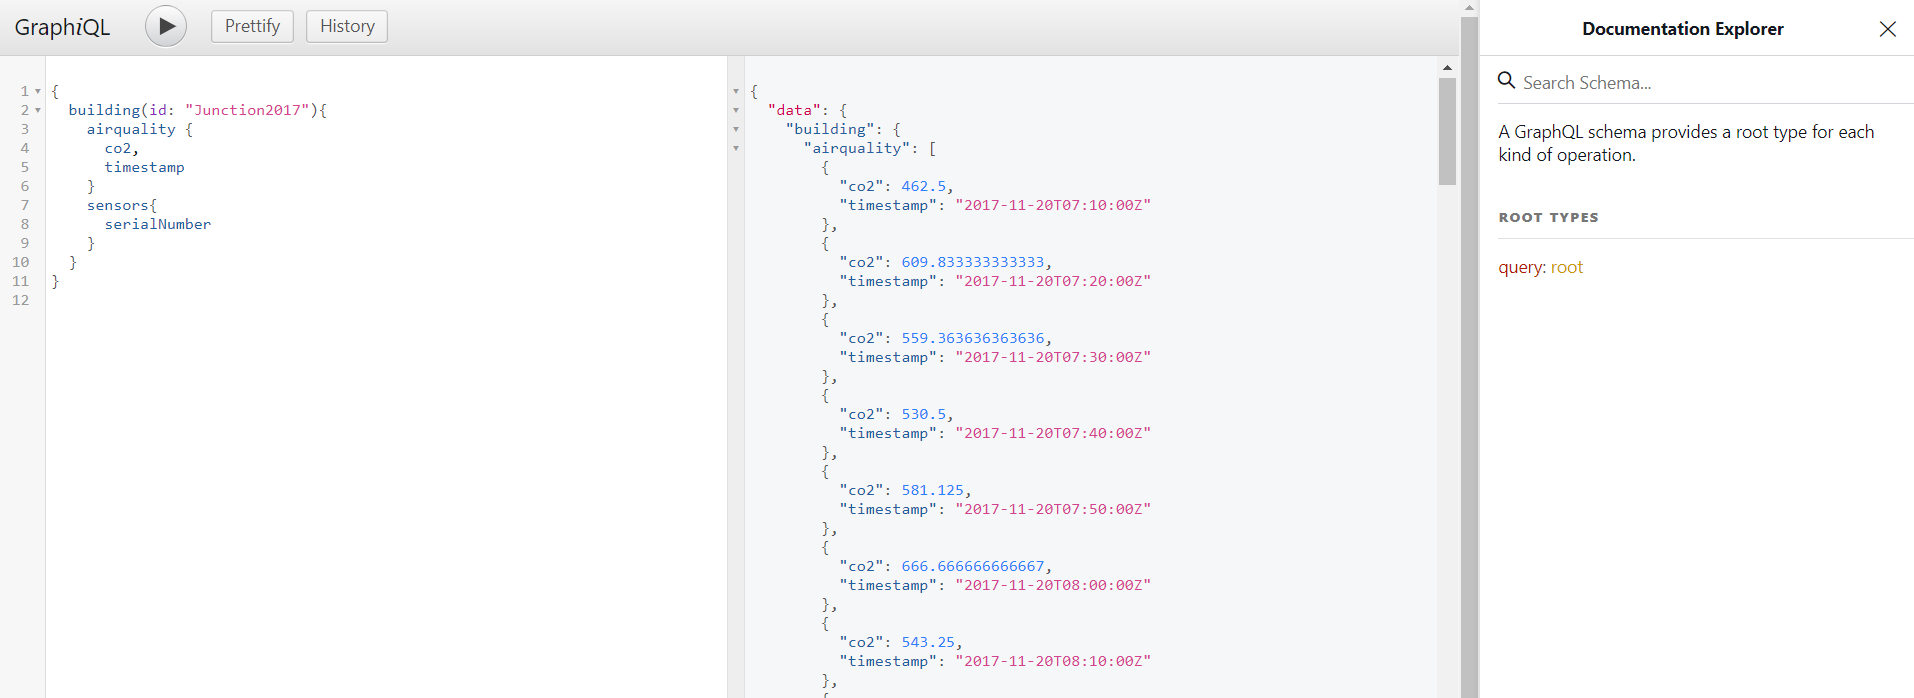
See the example react application in airquality folder. To run it execute
npm start
When you are happy with the query and the result at the sandbox, you can make an API call to the API endpoint to get this data as JSON for your application.
API endpoint to use is:
https://woodcityapiqa.azurewebsites.net/api/v1/GraphQL
Make a POST request to this endpoint with the following body:
curl -X POST \
--header 'Content-Type: application/json' \
-d '{ "query" : "{ building(id:\"Junction2017\") { airquality { co2, timestamp }}}" \
 }' \
'http://woodcityapiqa.azurewebsites.net/api/v1/GraphQL'
Notice -d data field is JSON object having one key "query" and the value is the composed in the sandbox query as string. Notice quotas marked with \" in the building ID.
{
    "query": "{ building(id:\"Junction2017\") { airquality { co2, timestamp }}}"
}
Once the query is executed, the result JSON will contain in this case air quality for overall building and more particular it's Co2 values.
Here is sample JavaScript code:
Define URL and Query to execute
let url = 'https://woodcityapiqa.azurewebsites.net/api/v1/GraphQL';
let query = {
    query: "{ building(id:\"Junction2017\") { airquality { co2, timestamp }}}"
}
Make a fetch request and gather result as JSON.
fetch(url, {
    method: 'POST',
    headers: {
    'Content-Type': 'application/json'
    },
    body: JSON.stringify(query)
})
.then(res => res.json())
.then(data => this.setState({
    data
}));
Make sure you understand that you can compose any query to get any data you are interested in. For instance I noticed that duting the day it is too hot at one of my meeting rooms. I want to compare it to overall building level of air quality and to the country average values in order to find out is it only in this particular room I have ventilation problems, or in all building or maybe all Finland is too humid and hot. In order to do this I need to post following request:
{
  building(id: "Junction2017"){
    airquality {
      temperature,
      humidity,
      co2
      timestamp
    },
    floor(number: 1){
      room(name: "main meeting room"){
        airquality {
          temperature,
          humidity,
          co2
        }
      }
    }
  },
  country(isoA3Code: "FIN"){
    airquality(function: "mean") {
      temperature,
      humidity,
      co2
    }
  }
}
The query will return the data containing building overall values, values for one meeting room "main meeting room" and country level averages.
Each reader emits plenty of raw data called Inventory Round. Ir reports every second to the server what is detected next to each antenna.
You can perform own calculations on the presence or absence of tags. This is happening before the data goes to MQTT broker. When data comes to the server it filters alot of it and them emits MQTT - is something entered or left the antenna.
As a developer you also have a chanse to receive raw data each second on what is next to each antenna right now.
You can use socket.io client.
See the
raw_reader_dataproject sample;
To run the sampel use
npm install
node index.js
The edge processing server is located at http://balabanovo.westeurope.cloudapp.azure.com, the reader mac address to use is 00:16:25:12:16:4F - this is the reader we have at Junction2017.
The message contains the reader MAC address and the raw readings it see now at each antenna:
{
    "macAddress": "00:16:25:12:16:4F", // MAC address of the reader, NOTE! we have several readers reporting to this socket server, use only one which is mentioned.
    "orderedRecords": [
       {
            "antenna_port": 0,
            "epc": "********",
            "first_seen_timestamp": 1511601782006,
            "peak_rssi": 44,
            "tid": "********",
            "scan_count": 1
       }
    ]
}antenna_port- the number of the antenna the tag is detected at (0,1,2 or 3) NOTE, it can be detected by several antennas, usepeak_rssiorscan_countto detect to which antenna the tag is closer;epc- the unique ID of the tag;first_seen_timestamp- timestamp of the reading event (ticks);peak_rssi- the max reflection power - 50 is the best. the more it goes to 0 - the worse the signal is.tid- the unique tag ID (in our case === toepc)scan_count- how many times tag was scanned for last second. The closer the tag to the antenna, the more scannings it gets. Reader scans them ever 20ms.