
This repository is a comprehensive guide to Machine Learning, designed to bridge theoretical concepts with practical, hands-on implementations. It serves as a learning lab for anyone—from beginners to practitioners—looking to deepen their understanding of core ML foundations and algorithms.
Goals
Demystify Machine Learning through structured explanations and illustrative examples
Organize ML algorithms into key paradigms: Supervised, Unsupervised, Semi-Supervised, and Reinforcement Learning
Enable experimentation with interactive Jupyter Notebooks for real-world learning
Support understanding of mathematical concepts and simplify complex topics like optimization, statistics, and linear algebra
Machine Learning (ML) is a subset of Artificial Intelligence that allows systems to learn from experience (data) and improve their performance on a task without being explicitly programmed with rules. Instead of following hardcoded instructions, the system identifies patterns in data and uses those patterns to make predictions or decisions.
Think of a baby learning to recognize animals. At first, the baby is shown pictures of cats and dogs. Over time, the baby begins to notice patterns — cats have pointy ears, dogs often have longer snouts. Eventually, the baby can identify a new picture as a "dog" or "cat" based on what they’ve seen before — even without being told the rules. Machine Learning works in a similar way: it learns from examples instead of being told exactly what to do.
A machine learning model learns to recommend movies based on a user's viewing history and preferences — just like how a friend might suggest a movie based on what you’ve enjoyed before.
This is by far the most widely used type of ML in real-world applications.
- What it is: You train a model on labeled data (i.e., the input and expected output are both known).
- Use Cases:
- Email spam detection
- Credit scoring
- Medical diagnosis
- House price prediction
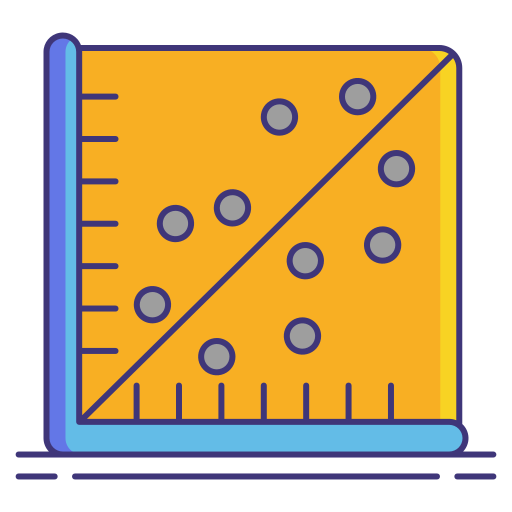 Linear Regression
-
Concept: Predicts a continuous value (e.g., student test score) based on one or more input features.
-
Essential Math:
$y = w_1x_1 + w_2x_2 + \cdots + w_nx_n + b$ -
It minimizes the Mean Squared Error (MSE) between predicted and actual values.
-
Use Case: Predicting prices, trends, or scores.
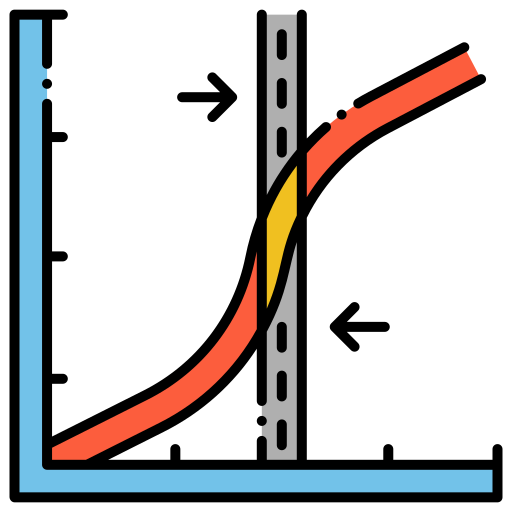 Logistic Regression
-
Concept: Used for binary classification (e.g., pass/fail, spam/ham).
-
Essential Math:
$P(y = 1 \mid x) = \sigma(w_1x_1 + w_2x_2 + \cdots + w_nx_n + b)$ Where the sigmoid function is:
$\sigma(z) = \frac{1}{1 + e^{-z}}$ -
Use Case: Disease prediction, marketing response, fraud detection.
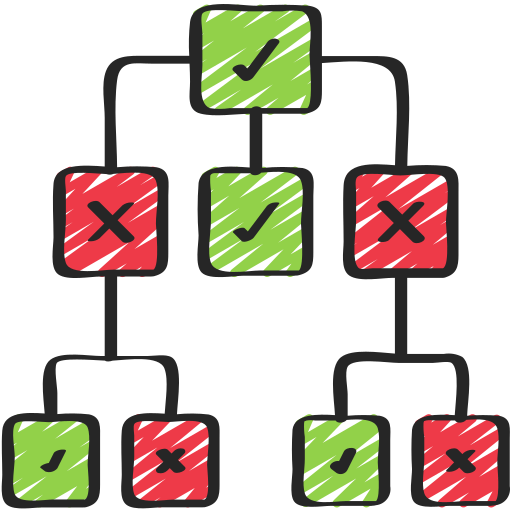 Decision Trees
-
Concept: A flowchart-like structure where each internal node splits the data based on a feature.
-
Essential Math:
-
Gini Impurity:
$G = 1 - \sum_{i=1}^{C} p_i^2$ -
Entropy (for Information Gain):
$H = - \sum_{i=1}^{C} p_i \log_2(p_i)$
-
-
Use Case: Customer segmentation, credit risk modeling.
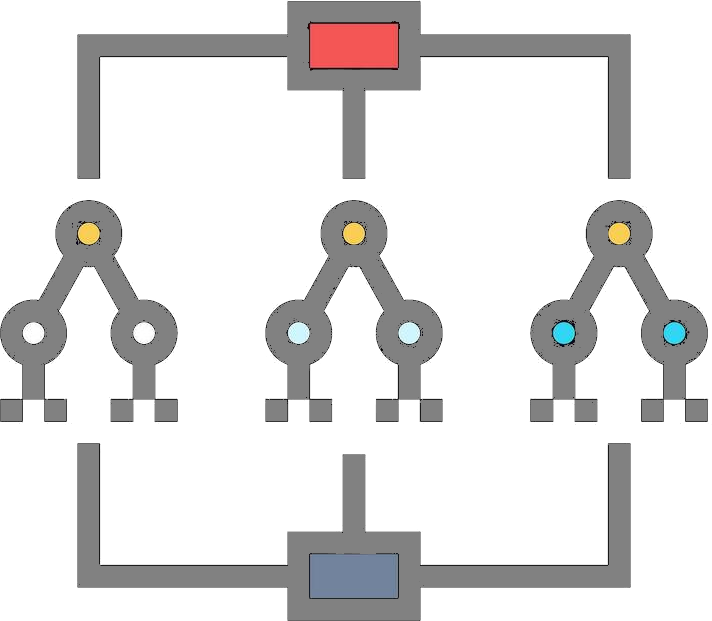
 Random Forest
-
Concept: An ensemble of decision trees trained on random subsets of data and features.
-
Essential Math:
-
For Regression:
-
-
For Classification:
-
Use Case: Robust classification and regression tasks, e.g., loan approval, stock prediction.
 Support Vector Machines (SVM)

-
Concept:
- Finds the hyperplane that best separates the data into classes.
-
Essential Math:
- Decision boundary:
$w \cdot x + b = 0$ - Optimization constraint:
$y_i(w \cdot x_i + b) \geq 1$ - Margin to maximize:
$\frac{2}{\lVert w \rVert}$
- Decision boundary:
- Can use the kernel trick (e.g., RBF kernel) to handle non-linear decision boundaries.
- Use Case: Text classification, face recognition, bioinformatics.
 k-Nearest Neighbors (kNN)

-
Concept: Classifies a sample based on the majority vote (classification) or average (regression) of its k closest neighbors.
-
Essential Math:
-
Euclidean Distance:
$d(x, x') = \sqrt{ \sum_{i=1}^{n} (x_i - x'_i)^2 }$
-
Euclidean Distance:
-
Other distance metrics can be used, such as Manhattan, Cosine, or Minkowski, depending on the data.
-
Use Case: Recommender systems, image classification, anomaly detection.
- What it is: The model tries to find patterns and groupings in the data without labeled outputs.
- Use Cases:
- Customer segmentation
- Market basket analysis
- Anomaly detection
- Popular Algorithms:
- k-Means Clustering
- DBSCAN
- PCA (Principal Component Analysis)
- Python Libraries:
scikit-learn,scipy,matplotlib
- What it is: An agent learns to make decisions by interacting with an environment and getting feedback (rewards or penalties).
- Use Cases:
- Robotics
- Game playing (e.g., AlphaGo)
- Self-driving cars
- Popular Libraries:
OpenAI Gym,Stable-Baselines,TensorFlow,PyTorch
- What it is: Combines a small amount of labeled data with a large amount of unlabeled data to improve learning when labeling is expensive.
- Use Cases:
- Web page classification
- Medical imaging
- Speech recognition
- Fraud detection
- Popular Algorithms:
- Self-training
- Label propagation
- Semi-supervised Support Vector Machines (S3VM)
- Graph-based methods
- Python Libraries:
scikit-learn,sklearn.semi_supervised,TensorFlow,PyTorch
Machine learning problems and evaluation metrics depend heavily on the type of data being used.
Understanding data types helps determine:
- Which algorithm to use
- Which preprocessing steps to apply
- Which evaluation metrics are appropriate
flowchart TD
    A[Data Types] --> B[Numerical]
    A --> C[Categorical]
    A --> D[Binary]
    A --> E[Time Series]
    A --> F[Text]
    A --> G[Image]
    A --> H[Tabular]

    B --> B1[Discrete]
    B --> B2[Continuous]

    C --> C1[Nominal]
    C --> C2[Ordinal]
Details
Numerical data represents quantitative values and can be measured.
Examples:
- Age: 25
- Salary: 5000
- Temperature: 22.5°C
- House price: 350000
Discrete
Integer values (counts)
- Number of customers
- Number of clicks
- Number of purchases
Continuous
Real values (measurements)
- Height
- Weight
- Time
- Price
Used in:
- Regression
- Forecasting
- Time series
graph TD
    A[Numerical Data] --> B[Discrete]
    A --> C[Continuous]

    B --> B1[Counts]
    B --> B2[Integer values]

    C --> C1[Measurements]
    C --> C2[Real numbers]
Categorical data represents labels or categories.
Examples:
- Color: Red, Blue, Green
- Country: Brazil, USA, Canada
- Payment method: Credit Card, Pix, Cash
Nominal (No order)
- Dog, Cat, Bird
- Red, Blue, Green
- Male, Female
No ranking exists.
Ordinal (Has order)
- Small, Medium, Large
- Low, Medium, High
- Bronze, Silver, Gold
Ranking exists, but distances are not meaningful.
Used in:
- Classification
- Segmentation
- Decision trees
graph TD
    A[Categorical Data] --> B[Nominal]
    A --> C[Ordinal]

    B --> B1[No order]
    B --> B2[Labels]

    C --> C1[Ordered categories]
    C --> C2[Ranking exists]
Binary data is a special case of categorical data with two values.
Examples:
- Yes / No
- True / False
- Spam / Not Spam
- Fraud / Not Fraud
Used in:
- Binary classification
- Logistic regression
- Precision / Recall / F1 evaluation
graph TD
    A[Binary Data] --> B[Yes / No]
    A --> C[True / False]
    A --> D[0 / 1]
    A --> E[Spam / Not Spam]
Data indexed by time order.
Examples:
- Stock prices
- Sales per day
- Temperature over time
- Website traffic
Characteristics:
- Order matters
- Cannot shuffle randomly
- Requires special validation
Used in:
- Forecasting
- Anomaly detection
- Sequential models
graph TD
    A[Time Series Data] --> B[Ordered by Time]
    A --> C[Temporal Dependency]
    A --> D[Trend]
    A --> E[Seasonality]
Unstructured textual information.
Examples:
- Emails
- Reviews
- Tweets
- Documents
Requires preprocessing:
- Tokenization
- Embeddings
- Vectorization
Used in:
- NLP
- Sentiment analysis
- Classification
graph TD
    A[Text Data] --> B[Unstructured]
    A --> C[Requires Processing]

    C --> D[Tokenization]
    C --> E[Embedding]
    C --> F[Vectorization]
Visual pixel-based data.
Examples:
- Photos
- Medical images
- Satellite images
Used in:
- Computer Vision
- Object detection
- Image classification
graph TD
    A[Image Data] --> B[Pixels]
    A --> C[Channels]

    C --> D[RGB]
    C --> E[Grayscale]

    A --> F[Computer Vision Tasks]
Most common structured format (rows and columns).
Example:
| Age | Salary | Country | Bought |
|---|---|---|---|
| 25 | 3000 | Brazil | Yes |
| 40 | 8000 | USA | No |
Used in:
- Most ML problems
- Classification
- Regression
graph TD
    A[Tabular Data] --> B[Rows]
    A --> C[Columns]
    A --> D[Features]
    A --> E[Target]
| Data Type | Typical Task |
|---|---|
| Numerical | Regression |
| Categorical | Classification |
| Binary | Binary Classification |
| Time Series | Forecasting |
| Text | NLP |
| Image | Computer Vision |
| Tabular | General ML |
The data type determines the evaluation metric:
| Data Type | Task | Metrics |
|---|---|---|
| Categorical | Classification | Accuracy, F1 |
| Binary | Classification | Precision, Recall |
| Numerical | Regression | MAE, MSE |
| Ranking | Retrieval | Precision@K |
| Time Series | Forecasting | MAE, RMSE |
-
Classification
A supervised learning task where the model learns to categorize data into predefined classes or labels.
Example: Predicting if an email is spam or not spam. -
Regression
A supervised learning task where the goal is to predict a continuous value.
Example: Predicting the price of a house based on size, location, etc. -
Clustering
An unsupervised learning method where the algorithm groups data into clusters based on similarity—without predefined labels.
Example: Segmenting customers into groups based on their behavior or purchases. -
Anomaly Detection
Identifying data points that are unusual or deviate significantly from the majority.
Example: Detecting fraudulent credit card transactions. -
Sequence Mining
Analyzing and identifying patterns in ordered data (sequences), especially over time.
Example: Finding common sequences in customer purchases or website navigation. -
Dimension Reduction
Reducing the number of features (dimensions) in a dataset while keeping important information—used to simplify models and visualize high-dimensional data.
Example: Using PCA (Principal Component Analysis) to reduce image data with thousands of pixels into just a few features. -
Recommendation System
A system that suggests items (movies, products, etc.) to users based on their preferences or behaviors.
Example: Netflix recommending movies or shows based on your watch history.
-
Problem Definition
Clearly define the objective of the machine learning task.
Example: Predict customer churn or classify product reviews as positive or negative. -
Data Collection
Gather relevant and sufficient raw data from various sources like databases, APIs, sensors, or manual input.
Example: Collecting user behavior logs or survey results. -
Data Preparation
Clean, transform, and structure the data for training. This includes handling missing values, encoding categories, and normalizing values.
Example: Converting text into numeric form or removing outliers. -
Model Development and Evaluation
Choose a model type, train it using prepared data, and evaluate its accuracy, precision, recall, or other relevant metrics.
Example: Training a decision tree and evaluating it using cross-validation. -
Model Deployment
Integrate the trained model into a production environment where it can receive real input and make predictions.
Example: Deploying a fraud detection model via an API to monitor real-time transactions.
machine-learning/
│
├── README.md                             # High-level introduction to Machine Learning
│
evaluations/
│
├── README.md
│
├── 01.metrics/
│   ├── 01.classification/
│   │   ├── confusion_matrix.md
│   │   ├── accuracy.md
│   │   ├── precision.md
│   │   ├── recall.md
│   │   ├── f1_score.md
│   │   ├── roc_auc.md
│   │   └── log_loss.md
│   │
│   ├── 02.regression/
│   │   ├── mae.md
│   │   ├── mse.md
│   │   ├── rmse.md
│   │   ├── r2_score.md
│   │   └── mape.md
│   │
│   └── 03.ranking/
│       ├── precision_at_k.md
│       ├── recall_at_k.md
│       └── ndcg.md
│
├── 02.validation/
│   ├── train_test_split.md
│   ├── cross_validation.md
│   ├── k_fold.md
│   ├── stratified_k_fold.md
│   ├── leave_one_out.md
│   ├── time_series_split.md
│   ├── bootstrap.md
│
├── supervised/
│   ├── README.md                       # Core concepts: labeled data, overfitting, etc.
│   ├── 01.linear_regression.md
│   ├── 02.logistic_regression.md
│   ├── 03.k_nearest_neighbors.md
│   ├── 04.naive_bayes.md
│   ├── 05.svm.md
│   ├── 06.decision_trees.md
│   ├── 07.random_forest.md
│   ├── 08.gradient_boosting.md
│   ├── 09.neural_networks.md
│   ├── algorithms/
│   └── notebooks/
│
├── unsupervised/
│   ├── README.md                       # Key ideas: clustering, dimensionality reduction, etc.
│   ├── 01.k_means.md
│   ├── 02.dbscan.md
│   ├── 03.hierarchical_clustering.md
│   ├── 04.pca.md
│   ├── 05.tsne.md
│   ├── algorithms/
│   └── notebooks/
│
├── reinforcement_learning/
│   ├── README.md                       # Basics of agents, environments, rewards, etc.
│   ├── 01.q_learning.md
│   ├── 02.sarsa.md
│   ├── 03.deep_q_network.md
│   ├── 04.policy_gradient.md
│   ├── algorithms/
│   └── notebooks/
│
├── semi_supervised_learning/
│   ├── README.md                       # Hybrid between supervised and unsupervised
│   ├── 01.self_training.md
│   ├── 02.label_propagation.md
│   ├── algorithms/
│   └── notebooks/
│
└── shared_resources/
    ├── datasets/                         # Sample datasets used across topics
    ├── utils/                            # Reusable utility functions
    └── references.md                     # Useful academic references and links
