


A graphical user interface for generating graphical plots on mathematical data. It can generate line plot, scatter plot, bar graphs , pie charts etc. Option for changing theme of the software, with different available linestyles and marker styles.
Images given below shows some of the functions.
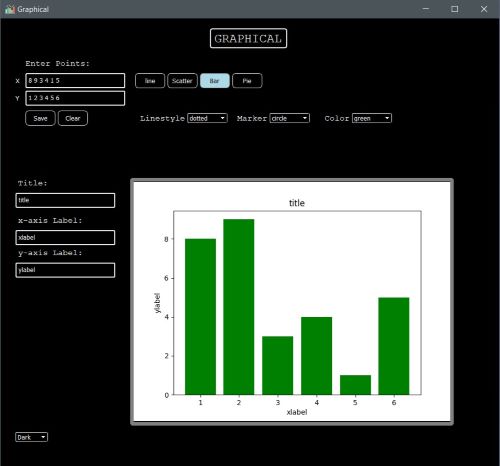
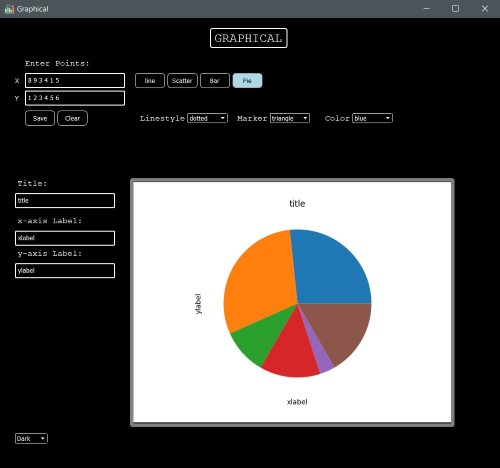

You have to give the data points in the input box at the top left and then select the which type of graph you want. You can select linestyle, marker style, color. You can put title, xlabel, ylabel and even change the dark theme to a light theme.