


Multi-resolution forest stand segmentation from satellite imagery, in Rust.
It implements the algorithm from Ye et al. (2025), which extends Harward and Woodcock's 1992 segmenter to take a second data layer. The original grows regions in one image and then forces the undersized ones to merge with whatever is nearest. The modification keeps that first stage as a micro-segmentation, and replaces the second with one that develops those micro-segments against a different image over the same grid: forest structure, age, or species over the same pixels.
 |
 |
|---|---|
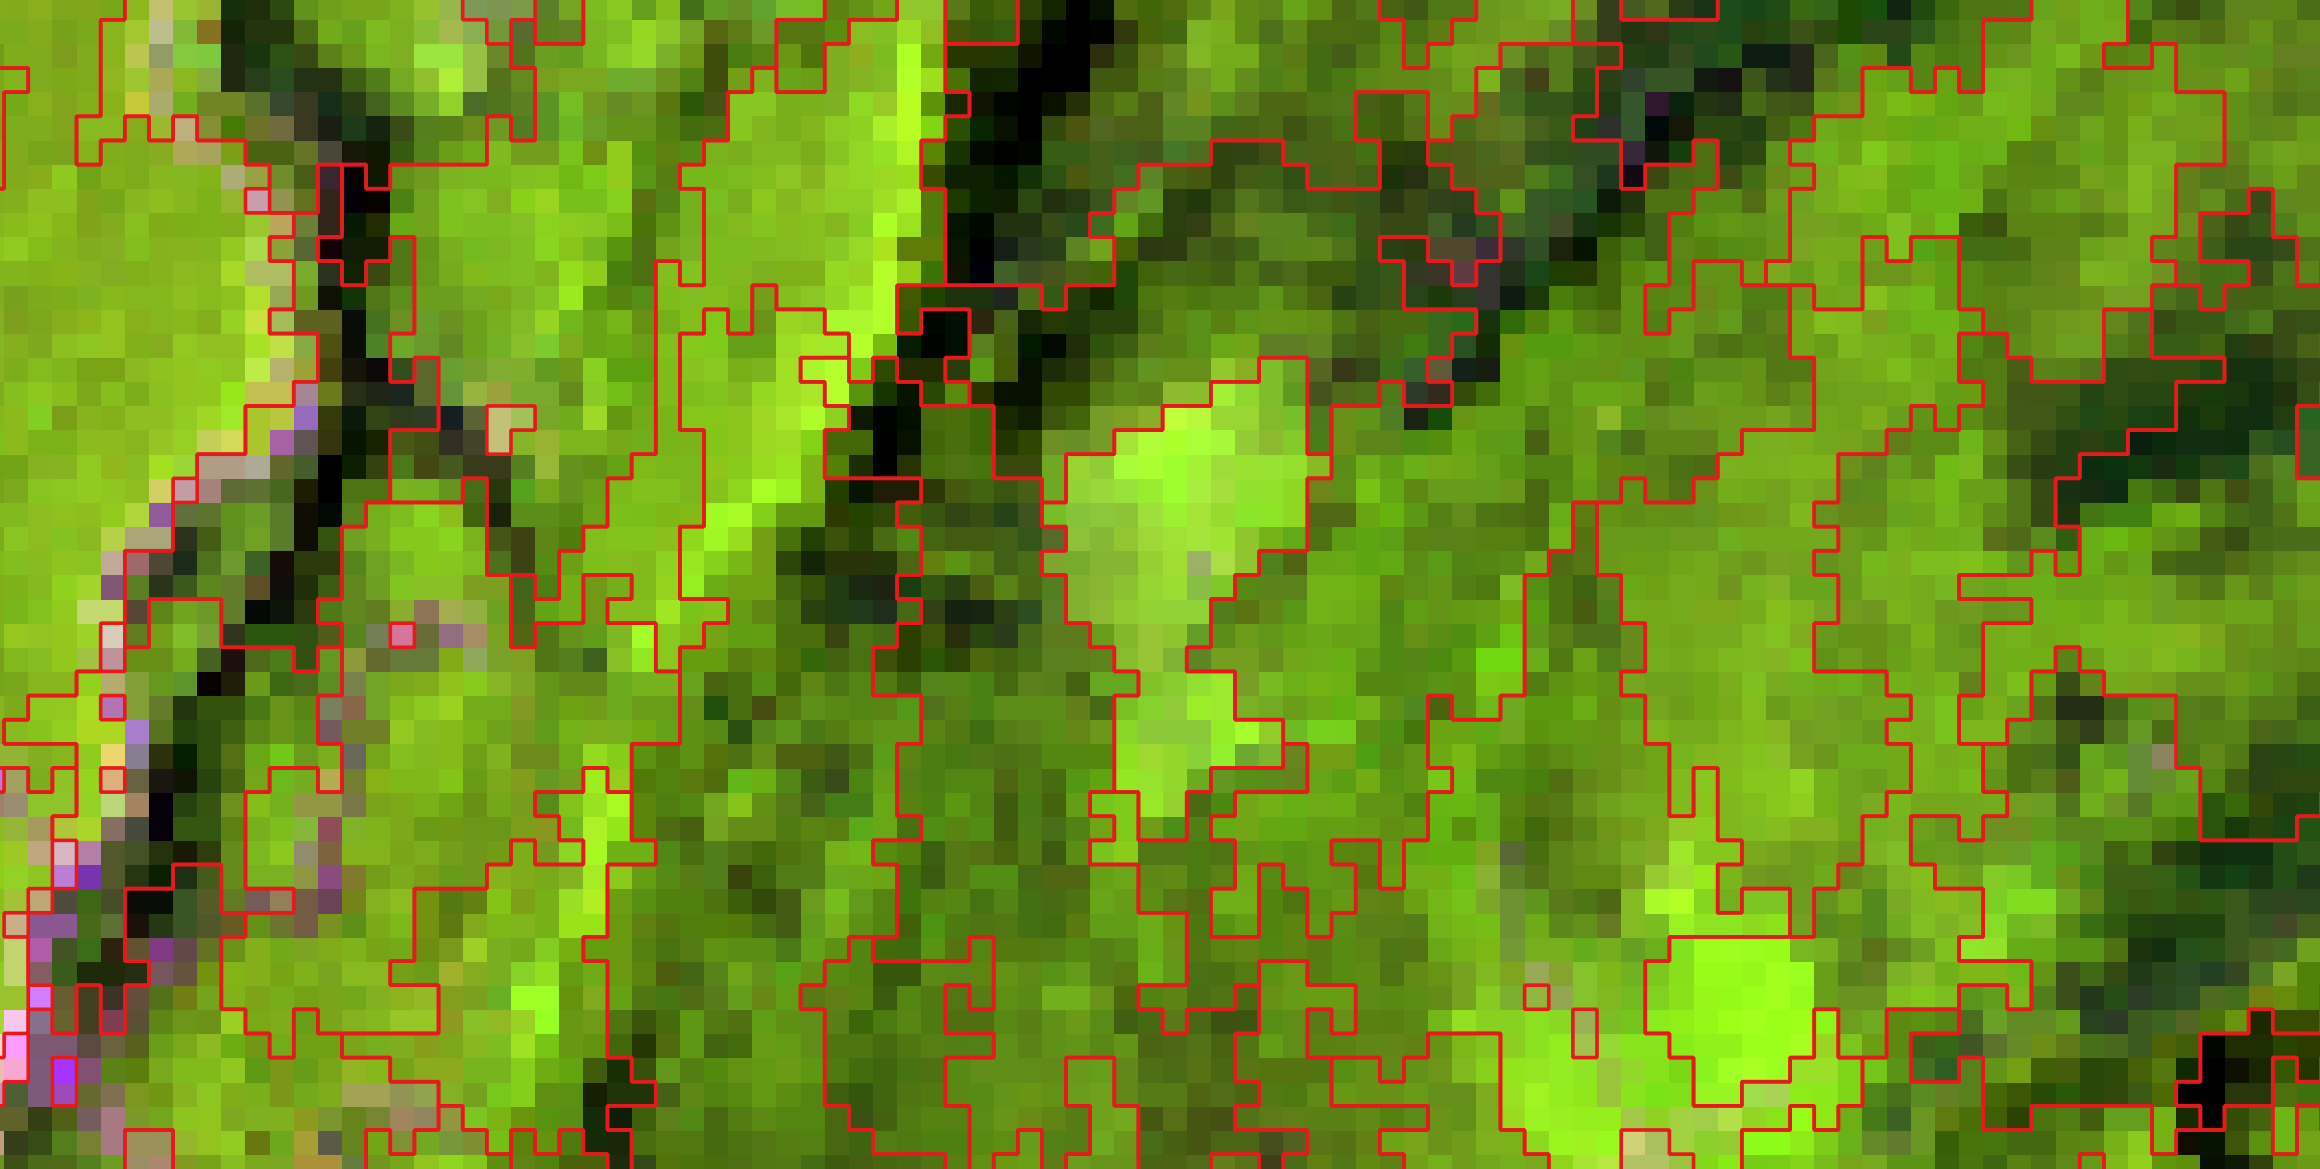
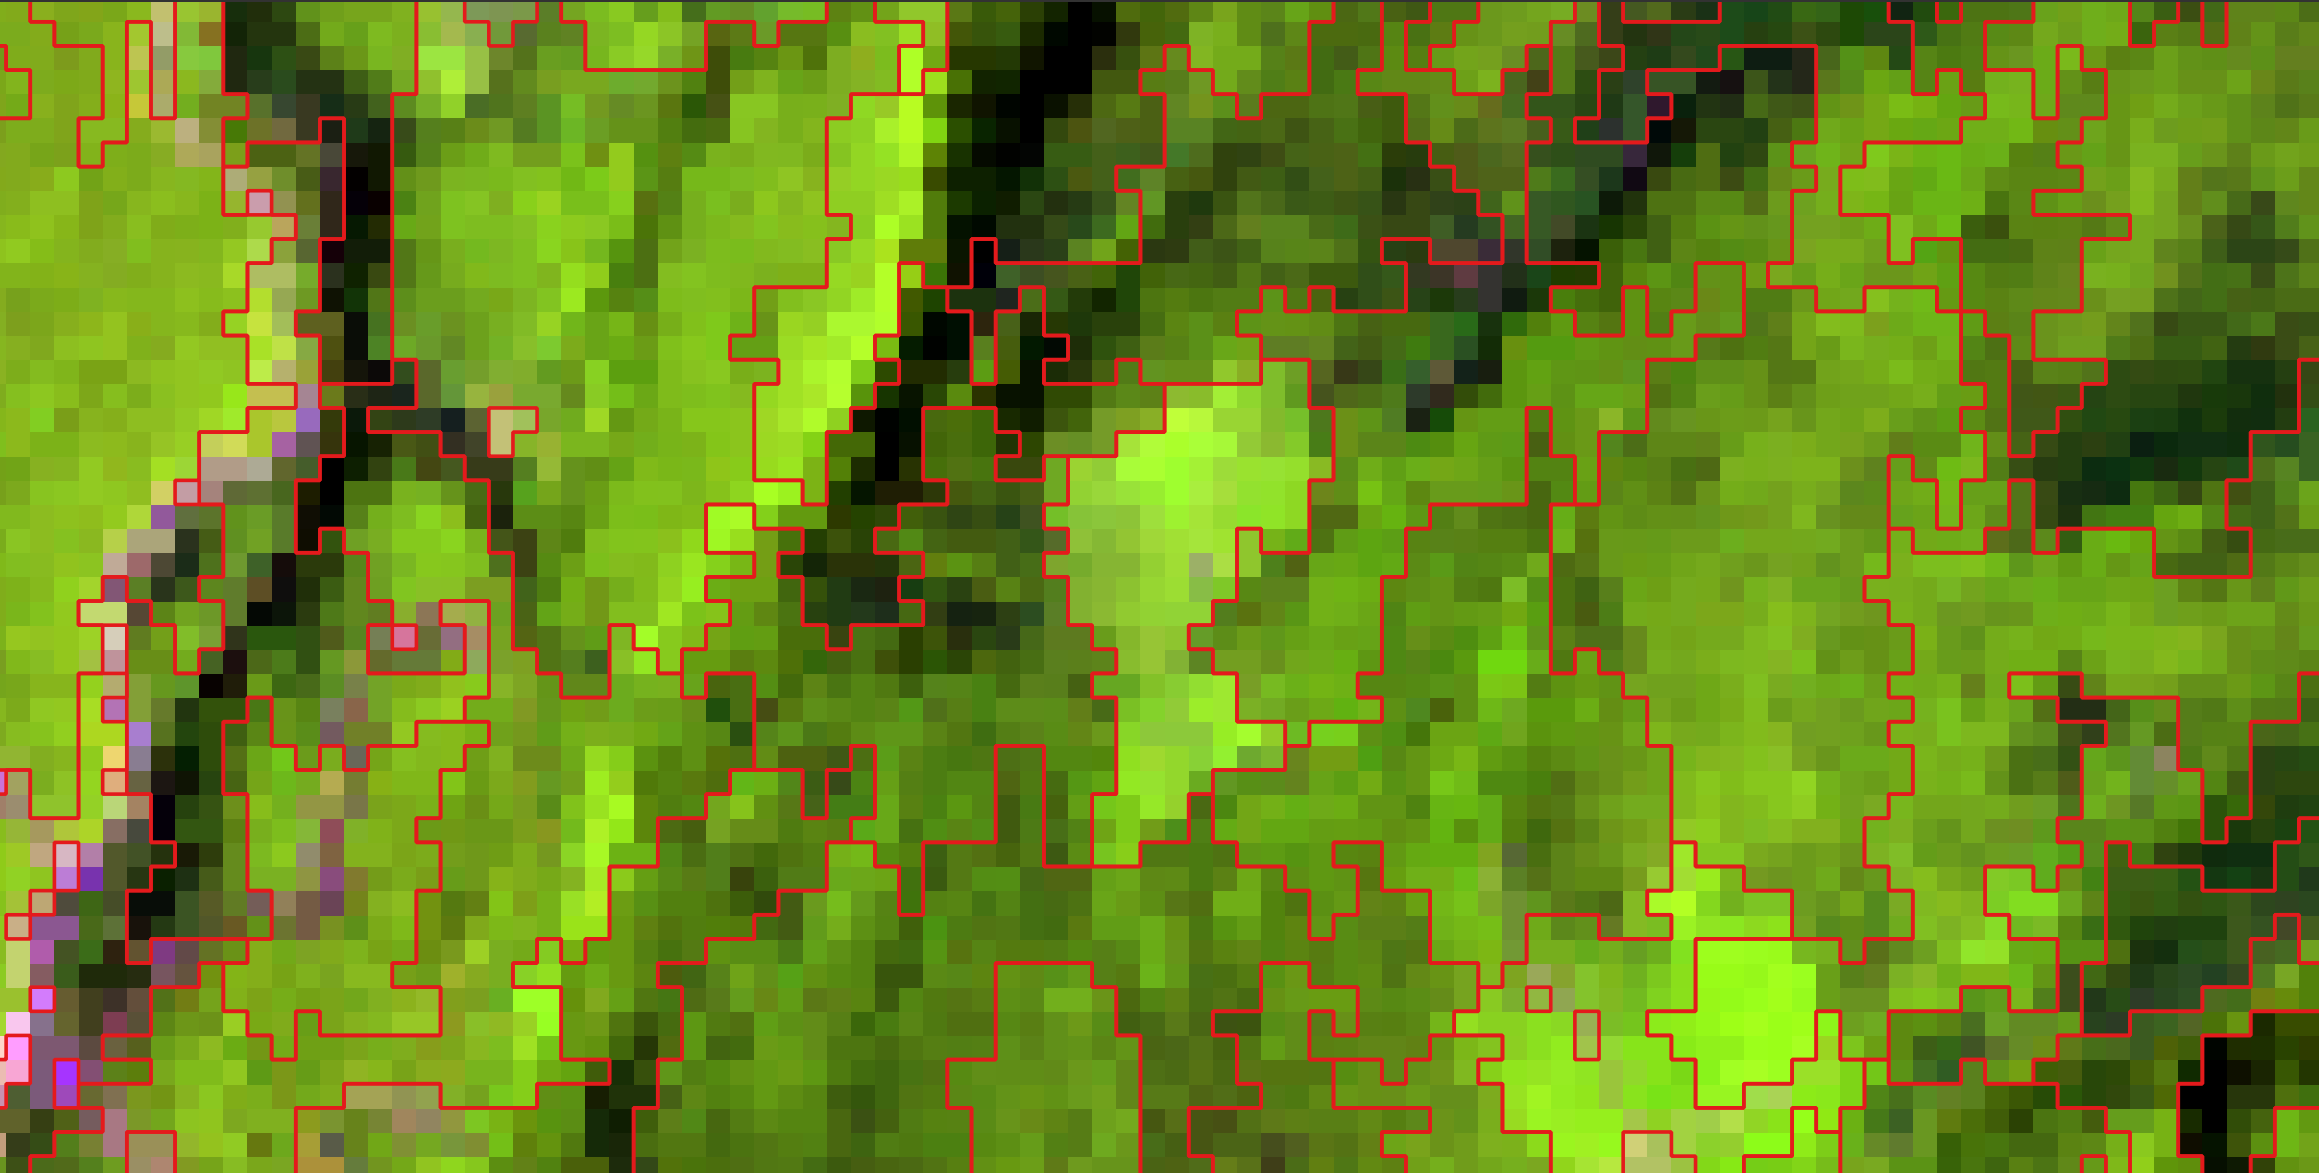
| second layer: stand age | second layer: canopy height (elev_p95) |
One Landsat scene, one phase 1, two second images. Phase 1 micro-segments the
spectral proxies; phase 2 develops those micro-segments against the layer you
give it, and the stands it draws are not the same ones. The second layers are
NTEMS products — forest age and canopy height (elev_p95) — from the Canadian
Forest Service and UBC; references under Licence.
The original algorithm is still in here and still exact. With one image the program does what the 1992 C did, byte for byte. The second layer is an option, not a fork, so both papers' methods run from the same binary.
It also handles images the C cannot — it segfaults above roughly 5000 × 5000 — and it is faster: 9.7 s where the original takes 24.5 s on a 5000 × 5000 tile, or 12.6 s if you rebuild the C with optimisation turned on, which its own Makefile does not.
This is for delineating forest stands from Landsat, and that is the only thing it has been validated on. The published results, the fixtures in this repository, and every byte comparison below are all Canadian forest tiles with Landsat spectral proxies and structure, age or species layers. Nothing stops you pointing it at other imagery, but I have not tested that and make no claim about it: the parameters, the size rules and the nodata convention were all chosen for stands, and I would not trust the output on another kind of scene without checking it against something you already believe.
I wrote the Rust with a coding agent, and the two old programs are what kept it
honest. Every change was checked by segmenting the same image with the C, the
Python and the Rust and comparing the output bytes, so "it looks right" was
never the standard. Neither oracle is in this repository, but what they produced
is: the fixtures under tests/golden/ and tests/stage2/ are their output,
checksum-pinned, and cargo test re-runs the comparison on your machine. See
How this was checked.
A 250 x 250 Landsat subset ships inside the download, under sample/, so there
is something to run on before you go and find data of your own. Unpack the
archive, open a terminal in the unpacked folder, and:
# macOS and Linux
./standseg -t 20 -m .2 -n 50,100,200 --format gpkg -o stands --outdir out sample/temp_byte_bip
# Windows PowerShell -- note the .\ and the backslashes
.\standseg.exe -t 20 -m .2 -n 50,100,200 --format gpkg -o stands --outdir out sample\temp_byte_bipWorking from a clone instead of a release archive? The binary is
target/release/standseg after cargo build --release, and the same scene is
tests/golden/misc/temp_byte_bip.
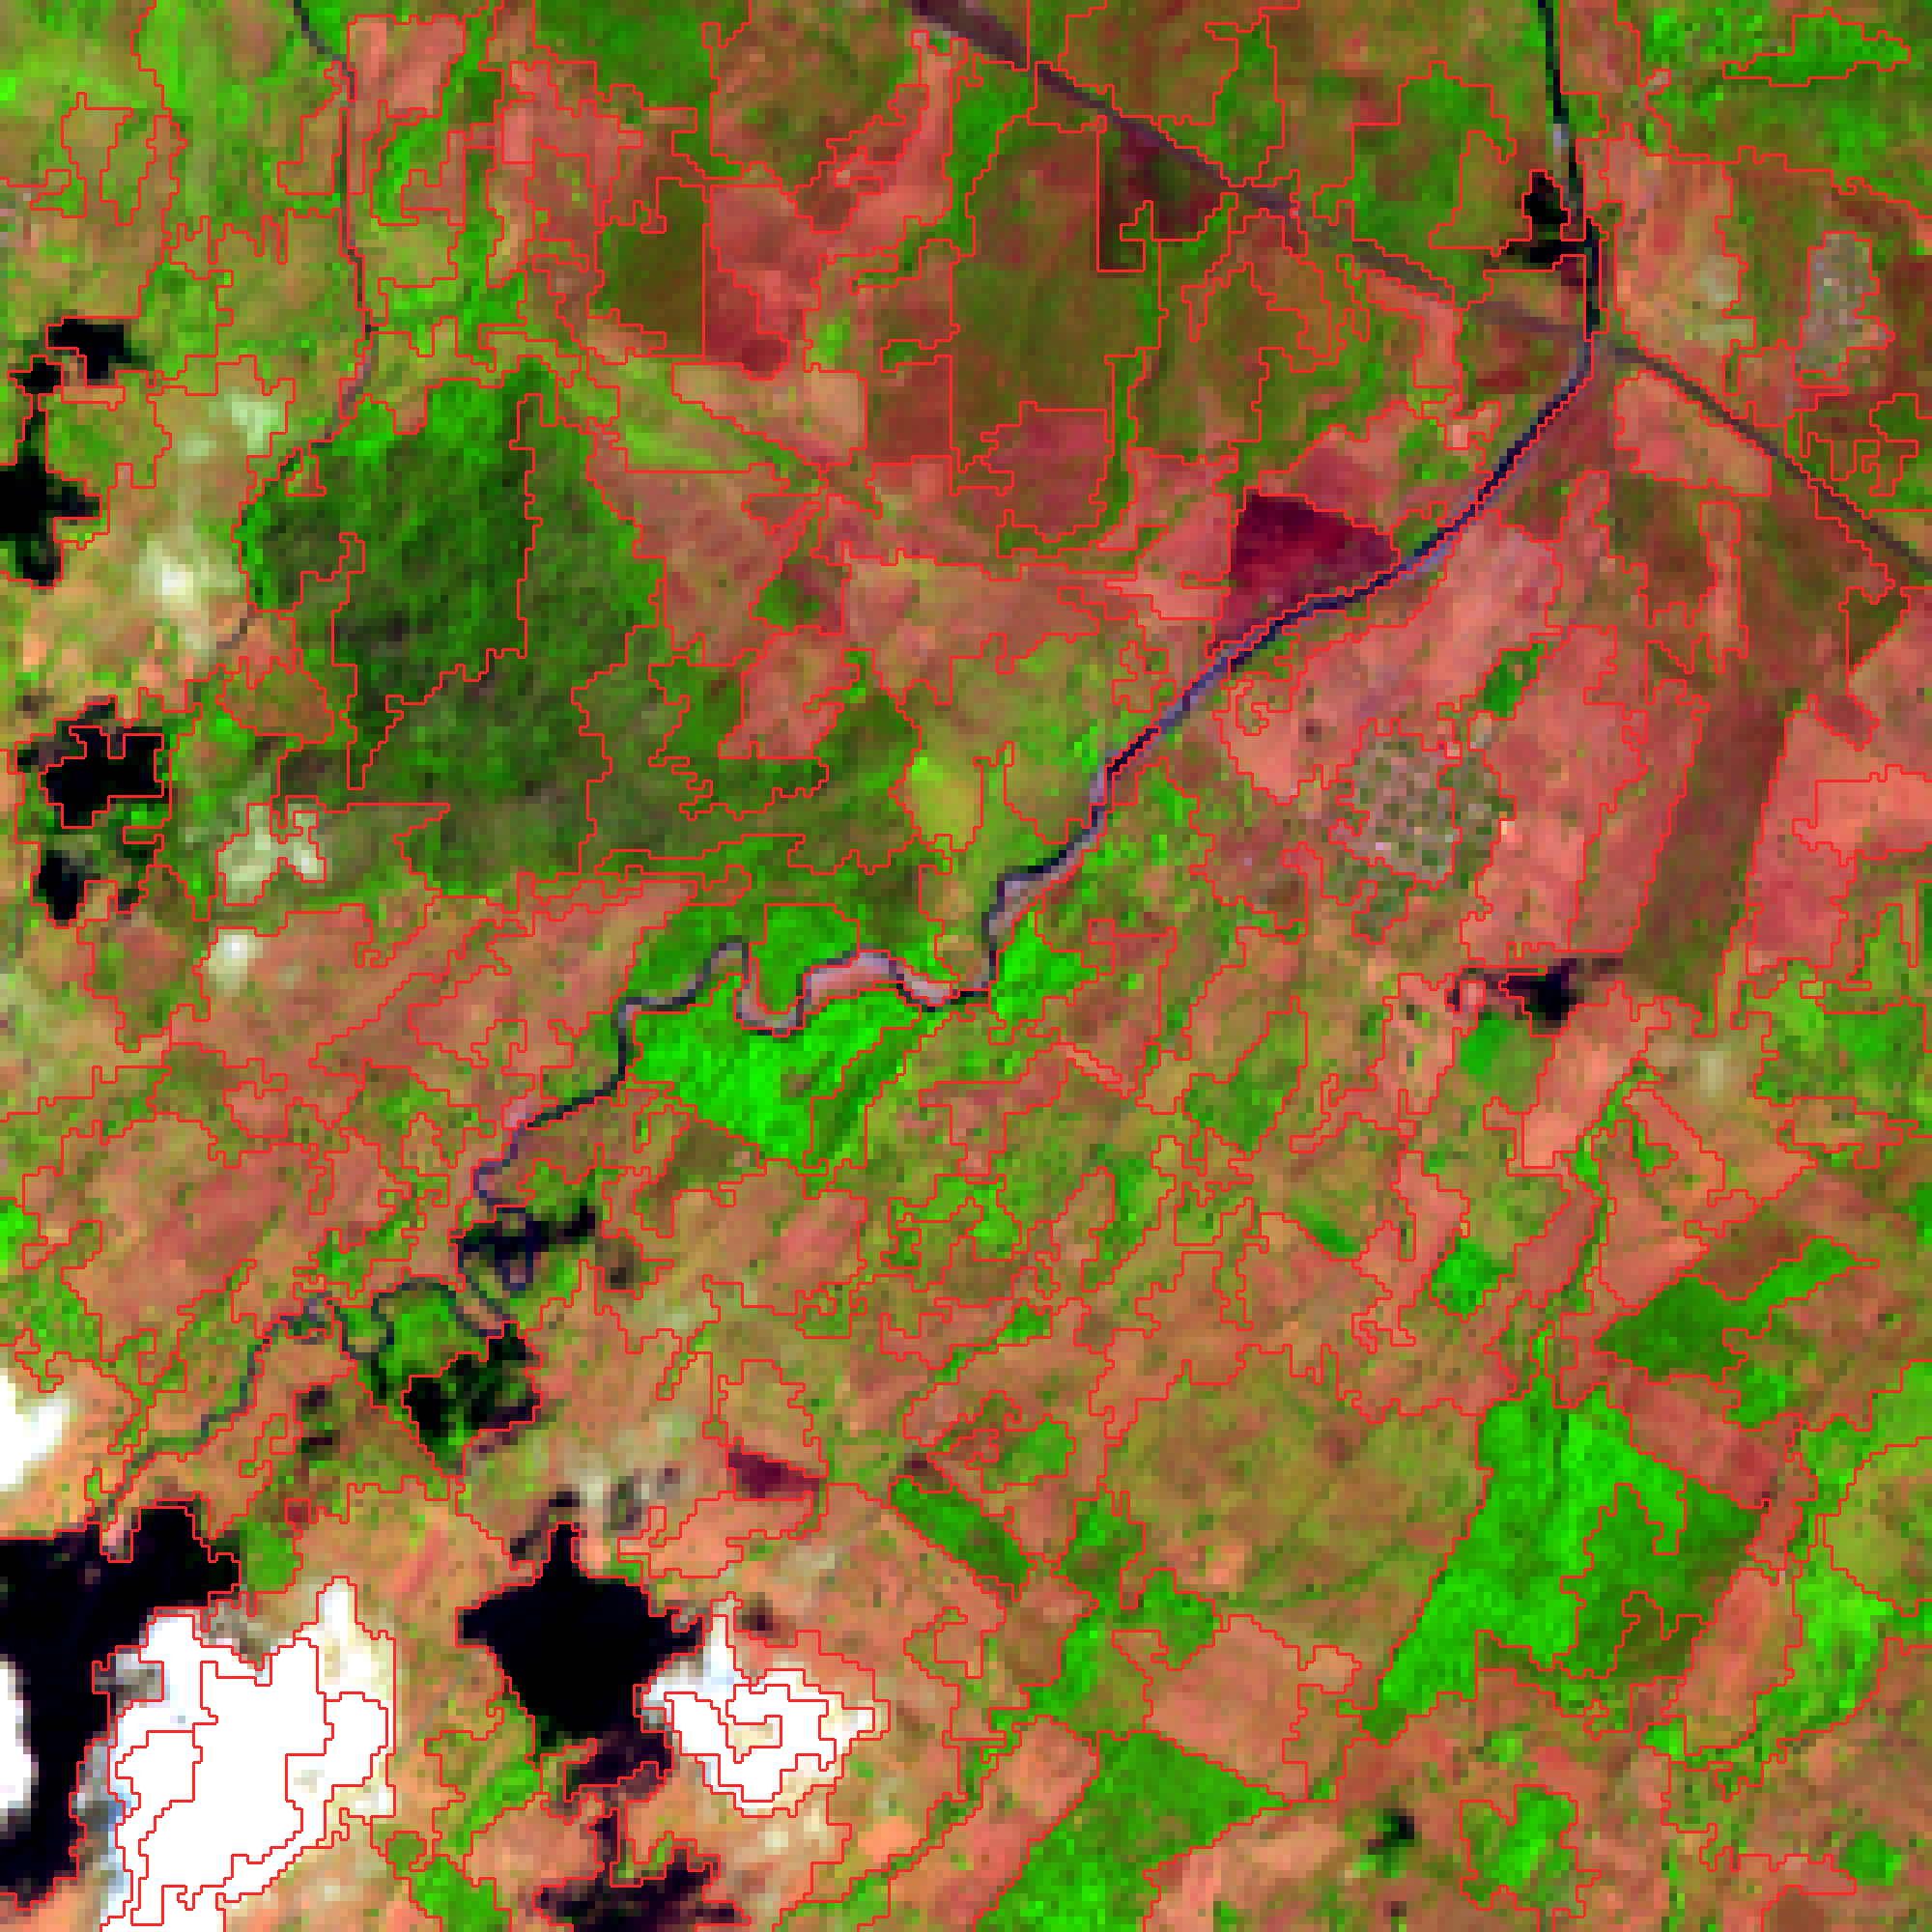
Landsat 8 OLI, WRS-2 path 22 / row 49, acquired 2014-03-24 (scene
LC80220492014083LGN00): a 250 × 250 subset at 30 m in UTM zone 15N over
Chiapas, Mexico, drawn here as a SWIR1/NIR/red composite. The red lines are the
163 stands standseg found, mean size 34.5 ha. Landsat data courtesy of the
U.S. Geological Survey. python3 docs/make_figure.py out/stands.armap.69
redraws it.
Two maps come out, with the pass count in the name: out/stands.rmap.81.gpkg
from phase 1 and out/stands.armap.69.gpkg from phase 2. --format gpkg makes
them GeoPackages — one polygon per stand, which QGIS, ArcGIS, sf and
geopandas open directly, and which you can also just query, because a
GeoPackage is a SQLite database (if you have sqlite3 — QGIS is the easier
route on Windows, where it is not installed by default):
$ sqlite3 -header out/stands.armap.69.gpkg \
    'SELECT region_id, n_pixels, area/1e4 AS ha FROM stands ORDER BY ha DESC LIMIT 3'
region_id|n_pixels|ha
29|1663|149.67
150|1536|138.24
124|1466|131.94
Leave --format off and you get ENVI rasters instead — the form every byte
comparison here is against. Run the 1992 reference parameters and the bytes are
identical to what the 1992 C produced. Its output is in sample/ too, so you
can check that claim yourself rather than take it:
# macOS and Linux
./standseg -t 10 -m .1 -n 15,15,100,2500,2500 -o demo --outdir out sample/temp_byte_bip
cmp out/demo.rmap.51  sample/regmap.rmap.51
cmp out/demo.armap.58 sample/regmap.armap.58
# Windows PowerShell -- fc /b is the built-in byte comparison
.\standseg.exe -t 10 -m .1 -n 15,15,100,2500,2500 -o demo --outdir out sample\temp_byte_bip
fc /b out\demo.rmap.51 sample\regmap.rmap.51
fc /b out\demo.armap.58 sample\regmap.armap.58cmp prints nothing and exits 0 when the files match; fc /b says
FC: no differences encountered. Anything else is a bug in this program — see
CONTRIBUTING.md. From a clone, cargo test --release runs
that comparison and a good deal more.
Phase 1 merges mutually-nearest regions within the tolerance, one merge per region per pass, until a pass produces none. Phase 2 forces the regions still below the minimum size to merge, with no distance ceiling.
Those are not universal parameters — -t in particular is a raw DN distance and
has to be scaled to your data. See Choosing -t before you
trust a map.
Download from the releases page, unpack, and run. One executable, no GDAL, no Python, no system libraries.
| Linux | statically linked, so it also runs on older distributions and HPC login nodes |
| macOS | universal (Apple Silicon and Intel), signed and notarized, so it runs without a Gatekeeper warning |
| Windows | .zip, x86-64 |
There is no installer and nothing to add to PATH unless you want to. The
program is one file that runs from wherever you unpacked it.
On Windows. Right-click the .zip → Extract All. Then open the extracted
folder, shift-right-click in the empty space → Open PowerShell window here,
and call the program as .\standseg.exe. Plain standseg will not work: it is
not on PATH, and PowerShell does not look in the current directory. Two other
things that catch people out — where a command below is split across lines with
a trailing \, that is bash syntax, so join it into one line first — and if
Windows blocks the first run with a "Windows protected your PC" banner, that is
SmartScreen reacting to an unsigned executable from the internet (the macOS
build is signed; the Windows one is not). Click More info → Run anyway, or
right-click standseg.exe → Properties → tick Unblock.
On macOS. chmod +x standseg if your unpacker cleared the bit, then run
./standseg. It is signed and notarized, so there is no Gatekeeper prompt.
To call it from anywhere, put it somewhere already on PATH — sudo cp standseg /usr/local/bin/ on macOS or Linux; on Windows, move the folder somewhere
permanent and add it under Edit environment variables for your account.
Anything else — or if you would rather build it:
cargo install --git https://github.com/Sugarc0de/standsegThat needs a Rust toolchain and a C compiler, because the GeoTIFF ZSTD support compiles a C library.
Every release binary is checked before it is published by segmenting the reference scene and comparing the result to the 1992 output byte for byte.
Add --stage2 and the same run micro-segments the first image, then develops
the result against the second:
# one image -- Woodcock & Harward, unchanged
standseg -t 50 -m 0.2 -n 9,18,36 -o stands proxies

# two images -- the same run, plus segment development
standseg -t 50 -m 0.2 -n 9,18,36 \
    --stage2 elev_p95 --n2 80,8000 -o stands proxies

# or develop a stage-1 map you already have, against a different second image
standseg --rmap stands.rmap.41 --stage2 age --n2 60,8000 -o stands_age
The intermediate stands.rmap.41 is a real output, byte-identical to what the
one-image run writes, so you can segment once and develop it several ways.
Three things about this phase are easy to trip over:
- A region merges with its nearest neighbour even when it is not that neighbour's nearest — the paper's relaxation, and the reason small segments get absorbed at all.
- The surviving id is the small region's, so ids in a
--stage2map are not comparable to a 1992armapby id. - A region more than half zero in the second image is dropped and zeroed.
That is how non-treed area enters: the layers are rescaled to 1–255 with 0
reserved, so the mask comes from the second image rather than from
-M.
The second image may be 32-bit float, which is how structural layers ship. The first may not — phase 1 works in integer DN, and that is enforced by the type system rather than a check that could be forgotten.
standseg temporal segments a series of images over one grid. The first step
is the two-image run above. At each later step only the pixels whose class
changed are segmented again; those segments are pasted into the previous result
and developed against that step's second image. Everything else carries forward.
# one row per step, in time order; `classes` is any categorical layer
# (land cover, burn severity, ...) whose change says what to redo
cat steps.csv
label,image,stage2,classes
2001,2001/proxies,2001/gsv,2001/landcover
2002,2002/proxies,2002/gsv,2002/landcover
2003,2003/proxies,2003/gsv,2003/landcover

standseg temporal --manifest steps.csv --normalize \
    -t 50 -m 0.2 -n 18,18,18,36,36 --n2 80,8000 -o site --outdir out
Rows are steps in time order. Columns are matched by name, and lines starting
with # are ignored. Relative paths are read from the manifest's own folder,
so a data folder can be moved together with its manifest. The label names
each step's outputs and must be unique.
Real data rarely has one naming scheme across products. In that case, write the manifest with a short loop instead of by hand:
{
  echo label,image,stage2,classes
  for y in $(seq 1984 2022); do
    echo "$y,refl/SR_${y}_fitted.dat,struct/height_${y}.dat,landcover/LC_${y}_v2.dat"
  done
} > data/steps.csv
This writes out/site.<label>.armap.<passes> per step. To give the steps on
the command line instead, repeat --image, --stage2 and --classes once per
step. To supply change masks directly, give --change once per step after the
first. --intermediates also writes each step's stage-1 map, change mask and
combined map. The files of a series must share one grid; if they carry
georeferencing, a file that is offset, has a different pixel size, or is in
another coordinate system is refused. Every file is checked before the first
step runs. --normalize rescales every input to 1–255 per band with nodata
→ 0, which is how the paper's inputs were prepared. standseg temporal --help
has the rest.
standseg --help lists all of them. The ones you will actually set:
| Option | Meaning |
|---|---|
-t <t1,t2,…> |
Segmentation tolerance, in raw DN. Required. One map per value. See below. |
-o <base> |
Output basename. Required. |
-n <a,b,c,d,e> |
Nabsmin,Nnormin,Nviable,Nmax,Nabsmax — ascending, 0 means no limit. |
-m <cm> |
Merge coefficient. Caps merges per pass at cm × nregions. |
--stage2 <image> / --n2 <min,max> |
The second image and its size rules. |
--rmap <file> |
Start from a saved stage-1 map and skip phase 1. |
--nodata <v> |
Nodata value; may be negative (Landsat's -9999). |
-M <file> / -8 |
Mask image; 8-way connectivity instead of 4-way. |
-B <band> / -N <low,high> |
Hold regions outside a normality interval to Nabsmin, so small non-forest patches are not absorbed. |
--outdir / --format / --threads |
Output directory; envi, tiff or gpkg; worker threads (output is identical either way). |
The 1992 program stopped at 65535 in every -n position because its pixel
counter was an unsigned short. That ceiling is gone; ask for
-n …,65535,65535 if you want it back.
This is the one parameter that will waste your afternoon, because getting it wrong does not produce an error. It produces a map.
-t is a distance in raw DN units. The published parameters (-t 50) are
for layers rescaled to 0–255. Landsat Collection 2 ships 16-bit, where the same
number means something roughly 250× smaller. On a 16-bit stack running
0–8990:
| tolerance | first pass | regions in the final map |
|---|---|---|
-t 10 |
merges almost nothing — 62 498 of 62 500 pixels stay separate | 5 304 |
-t 350 |
merges normally — 55 056 of 62 500 | 3 983 |
At -t 10 the spectral phase is inert, the size rules force merges anyway, and
you get a plausible-looking map that is 33 % off. Scale your tolerance by the
ratio of the data ranges — 8-bit to 0–8990 is a factor of about 35, which is how
-t 10 becomes -t 350. The program warns on stderr when it sees this, but the
warning is a safety net, not a substitute for scaling the number.
Read ENVI, IPW, TIFF/GeoTIFF and PNG; write ENVI (default, byte-compatible with the original), TIFF, or GeoPackage polygons. Format is detected from content first, extension second — the 1992 reference input has no extension at all.
Samples may be uint8, uint16 or int16, and --stage2 also takes float32.
The same values fed in at any integer width give bit-identical maps, so widening
is a generalisation rather than a second algorithm. Wider integers and float64
are refused with a message naming the type.
Bands map to samples-per-pixel, so a 6-band satellite stack is 6 bands. A PNG
alpha channel reads as an ordinary band and joins the spectral distance — use
--nodata or -M for transparency instead.
Product packages are out of scope: a Landsat Collection 2 tar is not an input. This program takes a raster of values on a grid — the spectral bands, or a structural attribute layer over the same pixels. Unpacking a delivery, applying the scale factors and stacking the bands are jobs GDAL already does well. Build the stack first, then segment:
gdal_merge.py -separate -o proxies.tif LC08_..._B{2,3,4,5,6,7}.TIFNodata pixels get region 0, never join a region, never contribute to a
centroid, and no region grows across them — without that, stands merge across
lakes. In the validated runs the excluded pixels are non-treed area, which the
layers carry as 0. The value comes from --nodata, else the file's own
declaration (ENVI data ignore value, GeoTIFF GDAL_NODATA); an -M mask
combines with either.
A pixel is nodata when all bands match, since masked-to-land imagery carries 0
everywhere over water while a single-band 0 is ordinary dark ground;
--nodata-any switches that.
Every map records the command that produced it, as ENVI history/software,
TIFF ImageDescription/Software, or the GeoPackage layer description. There is
no timestamp, on purpose: the same command twice gives byte-identical files.
--format gpkg writes the region map as polygons rather than pixels, which is
usually the point of segmenting in the first place. One feature per region:
| column | |
|---|---|
region_id |
the value the region carries in the raster map |
n_pixels |
pixels in the stand |
area |
n_pixels × the pixel area, in squared CRS units — divide by 10 000 for hectares in a metre-based CRS. Written only when the input is georeferenced, because a column of pixel counts labelled "area" is worse than no column |
The polygons are the raster. Vertices land on pixel corners, nothing is
smoothed or simplified, neighbouring stands share their vertices so there are no
slivers and no gaps, and a stand's geometry area equals n_pixels × the pixel
area exactly. A stand that -8 leaves in disjoint pieces is one multipolygon
rather than several rows, and a stand with a hole in it gets a hole.
Georeferencing comes from the input — an ENVI map info or the GeoTIFF model
tags — and becomes an EPSG code where one is derivable. An input with no
georeferencing at all still writes, in pixel coordinates, and says so on stderr
instead of implying a place.
One gap to know about: a CRS carrying no EPSG code survives from ENVI, where the
coordinate system string is copied through as WKT, but not from GeoTIFF,
where only the EPSG geokeys are read. Such a file gets correct map coordinates
under srs_id −1, "undefined", and you will have to tell your GIS what the CRS
is. Anything with an EPSG code — UTM, a national grid, plain WGS 84 — is
unaffected.
Nodata gets no polygon: region 0 is left out of the layer rather than exported as one enormous multipolygon riddled with holes, so the features cover the segmented area and nothing else.
Phase 1 maps are big as vectors. A micro-segmentation is millions of tiny regions, and each one costs a geometry, a row and an index entry. On a 2500 × 2500 scene the phase-1 map is 2.2 M features and 473 MB against 134 k features and 130 MB for phase 2, and writing both as GeoPackage takes 9.9 s where the ENVI rasters take 5.4 s. Vectorise the phase-2 map; keep phase 1 as a raster.
M-series laptop, 10 cores, 6-band imagery:
| scene | C, as its Makefile builds it | C, rebuilt -O2 |
this, serial | this, parallel |
|---|---|---|---|---|
| 5000 × 5000 | 24.5 s | 12.6 s | 13.3 s | 9.7 s |
| 15000 × 15000 | segfaults | segfaults | 157.9 s | 77.6 s |
A 5000 × 5000 tile needs about 0.7 GB, 15000 × 15000 about 5 GB. The C fails
above roughly 5000 × 5000 because ecalloc takes a signed 32-bit byte count and
the centroid list overflows it.
Only the nearest-neighbour scan is parallel — the merge loop is inherently sequential — so expect about 2×, not one-per-core. That is the price of bit-exact output, and it is deliberate.
On a whole NTEMS tile (5000 × 5000 × 6 proxies, 5000 × 5000 × 1 elev_p95,
paper parameters), one command with --stage2 takes 35.6 s and 1.20 GB, against
31.0 s and 1.17 GB for the one-image run. Phase 1 leaves 4 377 977
micro-segments; segment development takes them to 122 552 stands in 114 passes.
The Python that defines that phase takes 14.5 s to the Rust's 0.28 s on a
1000 × 1000 crop, for byte-identical output.
A segmentation is hard to eyeball — two maps can look the same and be different everywhere it matters — so byte equality against a program that already worked was the rule for the whole rewrite. There were two such programs: the original C for the first phase, and my Python for the second.
Against the C. Both 1992 reference cases reproduce byte for byte in both
phases, at the same pass numbers (51/58 and 17/1), with every per-pass statistic
in the original's log matching. There is also a byte-identical run at
5000 × 5000, 400× the area of the test cases. The fixtures ship in
tests/golden/, checksum-pinned and read-only, so cargo test --release
re-runs the comparison on your machine.
Against the Python. Six generated cases in tests/stage2/ reproduce byte
for byte, at the same pass counts and the same per-pass merge and rejection
counts. Beyond those, four whole NTEMS tiles went through both implementations
and were compared with cmp:
| tile | second-stage layer | passes | result |
|---|---|---|---|
| 397 | 6-band species, uint8 | 134 | identical, 100 000 000 bytes |
| 473 | 3-band structure, uint8 | 154 | identical |
| 474 | 1-band biomass, uint8 | 139 | identical |
| 219 | 3-band age, float32 | 130 | identical |
400 MB of region map, no differing bytes. The Rust runs took 21–26 s each; the Python took 1440–1780 s and 4.3–7.2 GB.
What does not reproduce. Both programs settle near-ties with a coin flip,
and ties are not rare — on a single-band 8-bit layer close to half of all pixels
have more than one nearest neighbour. The C's flip is random() & 01, never
seeded, so it at least repeats. My Python called randint(0, 1) while iterating
a set, which has no defined answer at all. So my 2023 second-phase maps cannot
be regenerated from their own inputs, by me or by anyone, and I did not know
that when I published. This version pins the rule — ascending region id, keep
the incumbent on a near-tie — and under it the coin is never reached.
The honest summary for anyone publishing from this: the method reproduces, my specific 2023 maps do not, and from here on a run is repeatable. The two implementations disagree with those maps on the same pixels (about 1 % on single-band layers, 0.02 % on six-band), which is what a tie-driven difference looks like and is how I know it is the tie-break rather than a bug. The one part with no tie-break in it — the set of dropped nodata regions — matches the 2023 maps exactly, on all 52 experiments tested.
Over a time series. I re-ran the pipeline from my second paper here, with
its helper code unchanged, on the three study sites I still have (39 years
each). Every artifact of all 117 steps matched byte for byte: stage-1 map,
change mask, combined map and final map. That is 461 MB with no differing
bytes. A 39-year site takes 4–11 s here against 1–11 min in the Python. Four
smaller cases ship in tests/temporal/. My archived 2024 runs of that pipeline
reproduce in every step except the second phase, which was evidently run with
code I never committed; PLAN.md §14.4 has the detail.
src/                  the segmenter
tests/golden/         1992 reference inputs and outputs, checksum-pinned
tests/stage2/         two-image segment-development fixtures, checksum-pinned
tests/temporal/       time-series fixtures, checksum-pinned
PLAN.md               design notes: algorithm, port hazards, memory, milestones
CONTRIBUTING.md       the rules the oracles impose; read before changing src/
Git does not preserve read-only permissions, so after cloning:
tests/lock_golden.sh and tests/verify_golden.sh (and the _stage2 and
_temporal equivalents).
MIT; see LICENSE. All of the code is my own — no third-party source is
redistributed here.
The test data is not mine. The scene under tests/golden/misc/ is a subset
of Landsat 8 LC80220492014083LGN00, a U.S. Government work in the public
domain, courtesy of the U.S. Geological Survey. That subset, and the reference
region maps under tests/golden/*/expected/proof/ that everything here is
checked against, were assembled by Chris Holden and come from
ceholden/segment, the extraction of the
Harward–Woodcock code from IPW that this program was validated against. That
repository states no licence terms.
The figures come from NTEMS, the National Terrestrial Ecosystem Monitoring System of the Canadian Forest Service and the University of British Columbia, distributed at opendata.nfis.org. No NTEMS data is redistributed here — the figures are renderings — but NTEMS asks that its products be cited, and the two second layers and the Landsat composites beneath them are its:
Matasci, G., T. Hermosilla, M. A. Wulder, J. C. White, N. C. Coops, G. W. Hobart, D. K. Bolton, P. Tompalski and C. W. Bater. 2018. Three decades of forest structural dynamics over Canada's forested ecosystems using Landsat time-series and lidar plots. Remote Sensing of Environment 216: 697–714.
Maltman, J. C., T. Hermosilla, M. A. Wulder, N. C. Coops and J. C. White. 2023. Estimating and mapping forest age across Canada's forested ecosystems. Remote Sensing of Environment 290: 113529.
Hermosilla, T., M. A. Wulder, J. C. White, N. C. Coops, G. W. Hobart and L. B. Campbell. 2016. Mass data processing of time series Landsat imagery: pixels to data products for forest monitoring. International Journal of Digital Earth 9(11): 1035–1054.
Which paper to cite depends on which half of the program you used.
- One image is Woodcock and Harward's algorithm, unchanged and byte-exact — Ye et al. contributed nothing to that path. Cite Woodcock & Harward.
- Two images (
--stage2) is the segment development of Ye et al., built on Woodcock and Harward's phase 1. Cite both.
For the software itself, CITATION.cff carries the metadata GitHub and Zenodo
read.
Ye, E., N. C. Coops, M. A. Wulder and T. Hermosilla. 2025. A multi-resolution forest stand segmentation algorithm integrating Landsat imagery and forest structural, age, and species attributes. ISPRS Journal of Photogrammetry and Remote Sensing. https://doi.org/10.1016/j.isprsjprs.2025.05.023
Woodcock, C. and V. J. Harward. 1992. Nested-hierarchical scene models and image segmentation. International Journal of Remote Sensing 13(16): 3167–3187.
Original algorithm and C implementation by Jud Harward and Curtis Woodcock, Boston University, building on the IPW library from UC Santa Barbara.