# Get a quick overview of what we are dealing with in our dataset 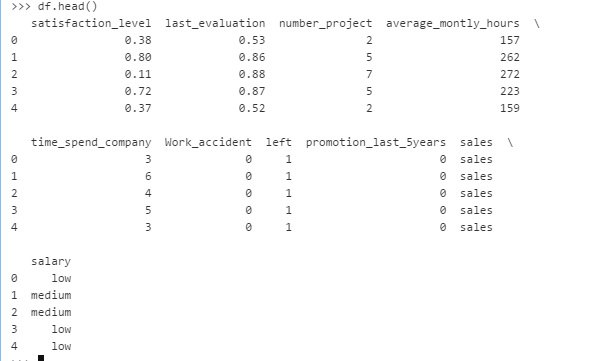 # Move the reponse variable "turnover" to the front of the table 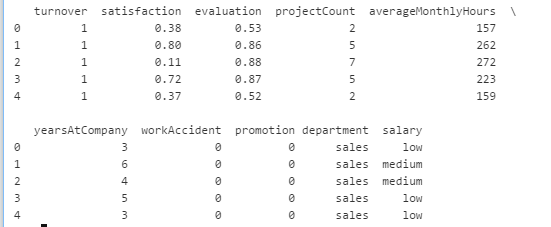 # Check the type of our features. 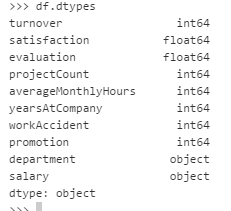 # Display the statistical overview of the employees 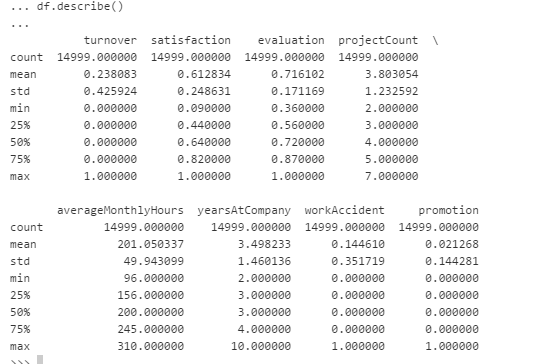 # Overview of summary (Turnover V.S. Non-turnover) 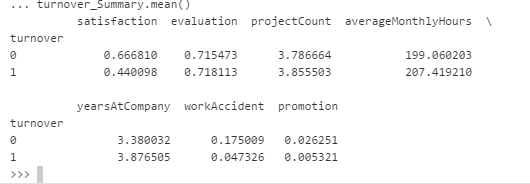 # Correlation Matrix 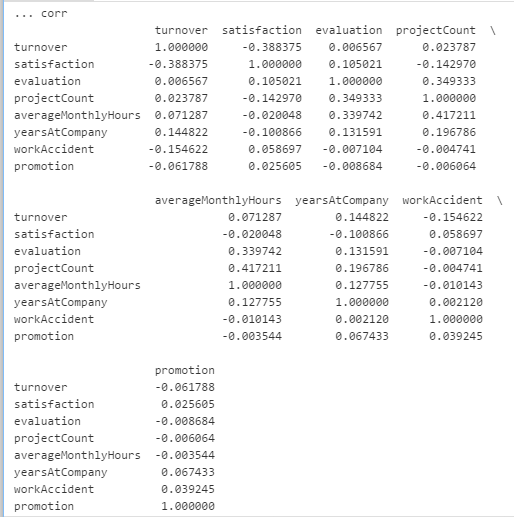 # Heatmap 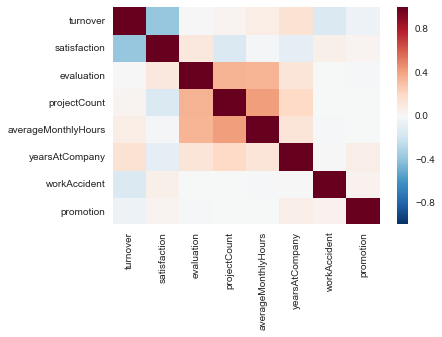 # Graph Employee Satisfaction 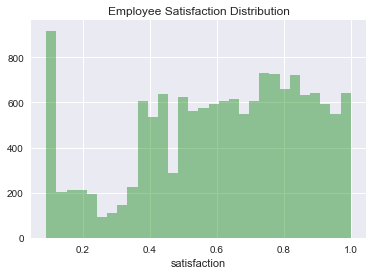 # Let’s have a look at boxplot of years at company vs average monthly hours 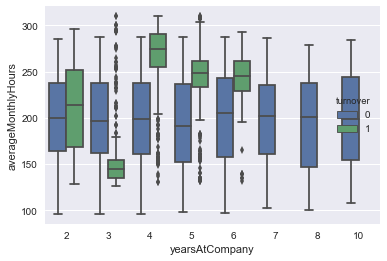 # Let’s have a look at lmplot satisfaction vs evaluation and print regression line 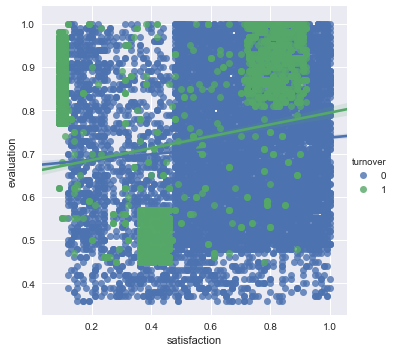
Get a quick overview of what we are dealing with in our dataset
Move the reponse variable "turnover" to the front of the table
Check the type of our features.
Display the statistical overview of the employees
Overview of summary (Turnover V.S. Non-turnover)
Correlation Matrix
Heatmap
Graph Employee Satisfaction
Let’s have a look at boxplot of years at company vs average monthly hours
Let’s have a look at lmplot satisfaction vs evaluation and print regression line